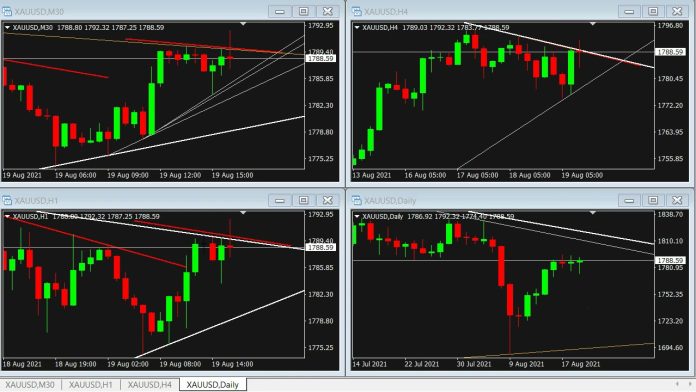
Many traders find charting stressful – but it shouldn’t be. The most successful financial traders all specialize in certain types of trading, whether it be swing trading, day trading, or long-term trading. They all use their own systems, and these systems all involve entry and exit signals. Candlestick trading patterns are among the most commonly used signals by profitable traders.
Candlestick charts are used to determine possible price movement based on past patterns. They’re an integral aspect of technical analysis, but do require some getting used to before they can be used effectively. It’s really important to know the most suitable chart pattern for the market you’re trading in, as using the wrong one or not knowing which one can mean missed opportunities and lost profits.
Some chart types are better suited to specific markets, for example certain patterns will work better for a more volatile market and others can be better used in more stable climates. In order to understand the signals below, first it’s important to understand the terms ‘bullish’ and ‘bearish’ markets.
The term bullish comes from the bull, who strikes upward with his horns and pushes prices up higher. The bull market is one that is on the rise, where the conditions of the economy are generally favorable. A bearish market in comparison means prolonged declining of prices, this market exists in an economy that is receding and where most stocks are decreasing in value. Here are 7 essential signals worth knowing as a trader.
- Cup and handle
The cup and handle is considered a bullish signal; this pattern consists of a drop in price, but then a rise back up to the original value. It is followed first by a smaller drop, and then a rise past the previous peak. The cup and handle pattern shows that the price of an asset is likely to enter a temporary retracement (the ‘handle’) because this retracement is confined to two parallel lines on the price graph. The asset will eventually reverse out of the handle and continue with a bullish trend overall.
- 2. Wedges
The wedge pattern is formed when an asset’s price movements tighten between two sloping trend lines. These lines show that the highs and the lows are either rising or falling at differing rates, which gives the appearance of a wedge as the lines approach a convergence. Wedges that are rising represent a bearish market and those that are falling represent a bullish market.
- 3. Pennant or flags
Flag or pennant patterns are created after an asset experiences a period of upward movement, followed by a consolidation. When these are seen, it means that there will be a significant increase during the early stages of the trend. It will then enter into a series of smaller upward and downward movements
- 4. Ascending triangle
The ascending triangle is a bullish continuation pattern which signifies the continuation of an uptrend. Ascending triangles are bullish patterns that indicate accumulation. In contrast to the symmetrical triangle, an ascending triangle has a definitive bullish bias before the actual breakout.
- 5. Descending triangle
Also referred to as the ‘falling triangle’, the descending triangle pattern is one of the top continuation patterns that appear in the middle of a trend. A descending triangle signifies a bearish continuation of a downtrend, and usually forms during a downtrend as a continuation pattern. Typically, a trader will enter a short position during a descending triangle.
- 6. Symmetrical triangle
The symmetrical triangle pattern can be either bullish or bearish, depending on the market. In either case, it is normally a continuation pattern, which means the market will usually continue in the same direction as the overall trend once the pattern has formed.
- Head and shoulders
This chart pattern shows a large peak (the head) with a slightly smaller peak on either side of it (the shoulders). Traders look at head and shoulders patterns to predict a bullish-to-bearish reversal. Typically, the first and third peak will be smaller than the second, but they will all fall back to the same level of support, otherwise known as the ‘neckline’.


